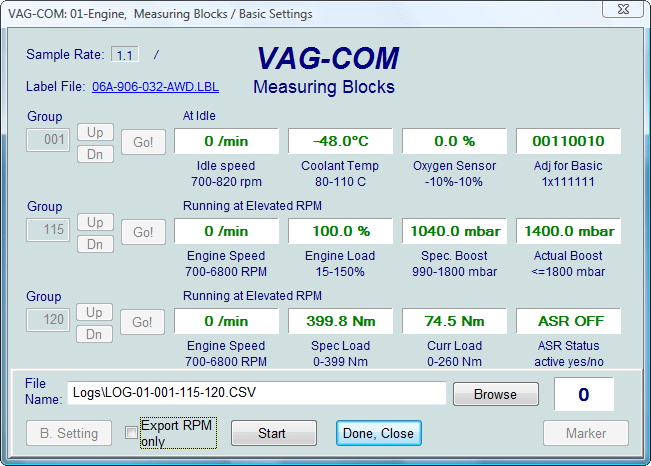
You can
log the data from the Measuring Blocks screen to a .CSV
file. These files can be opened and
analyzed with Excel or other spreadsheet applications.
Export
RPM Only when
checked will record only RPM from the first field and will
not record other fields. Also, this will only record RPM
values that are non-zero. This feature can be useful if you
are logging to output the file to a spreadsheet or other
third party software.
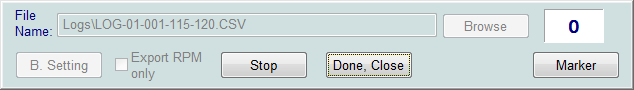
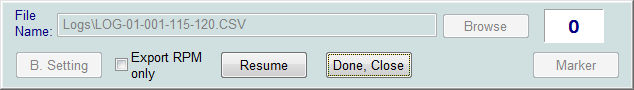
While the Log Dialog is open,
[Start],
[Stop], and
[Resume] can all be
done with the same button.
[Start] begins saving the data to a log file.
[Resume]
continues the saving of data
to a log file.
The
[Marker] function places a
sequential number in the file when you click the Marker button. This can
be helpful for data analysis.
The
[Browse] button allows you
to specify the location for your logs. By default, Log Files will be placed in the LOGS
sub-folder in your PC�s VAG-COM directory.
By default, the name of the log file
will be the controller number followed by the number for each group
number that you are logging. The name can be changed to anything you'd
like. If you re-use an existing filename, your new data will be appended
to that file.
Switch to Basic Settings is not
currently available while logging (but may be added later). However,
you can start a log while you're in Basic Settings. If VAG-COM keeps
insisting that it can't open a Log file, you're probably missing the
LOGS folder and should re-install VAG-COM.
Example using Microsoft Excel:
1. Choose group or groups that you want to view.
2. Click
[LOG] button
3. Use default file name if desired. It will append the old file if you
use a particular name more than once.
4. Click
[DONE] when
you're finished logging data.
5. Open Microsoft Excel
6. Click File->Open (change filetype to all *.*) and select the log
file that you made.
7. With mouse select the columns you want to graph.
8. Click the Chart Wizard button.
9. Select XY (Scatter) and click one of the formats that has lines.
10. The chart wizard will prompt you to name axes if you want.
You can also use the
[VAG-Scope] plug-in for
VAG-COM that allows you to replay LOG files. See the
VAG-Scope page.
Warning!
- If you're going to use VAG-COM while you're driving,
please use a second person!
- Let one drive while the other observes the data, making
sure the person holding the PC is not in front of an active airbag! Obviously, do not break any laws,
speeding or otherwise while using VAG-COM!